
Baseline and emissions profile for 2014-15
Tasmania’s total greenhouse gas emissions in 2015 were 0.89 mega‑tonnes of carbon dioxide equivalent, which is a 95 per cent reduction from 1989-90 baseline levels.
Tasmania’s 1989-90 baseline greenhouse gas emissions were 19.40 mega‑tonnes (Mt) CO2-e. The State’s total emissions for 2014-15 were 0.89 Mt CO2-e, which is a 95 per cent reduction from the baseline. This means that for the third year in a row, Tasmania has exceeded its legislated emissions reduction target of 60 per cent below 1990 levels by 2050 (see Figure 1).
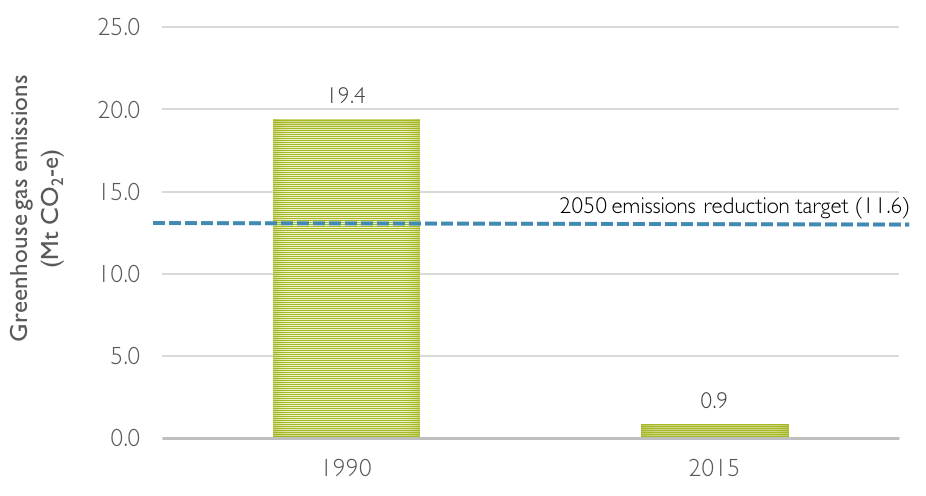
Figure 1: Comparison of 1989-90 baseline and 2014-15 greenhouse gas emissions for Tasmania with the legislated emissions reduction target of 60 per cent below baseline levels
Emissions profile for 2014-2015
The most significant reduction in emissions can be attributed to the LULUCF sector, which has become a carbon sink of -7.01 Mt CO2-e in 2014-15, effectively offsetting a large portion of emissions from other sectors.
Notwithstanding the benefits of the carbon sink held in Tasmania’s extensive forests, total Tasmanian emissions excluding LULUCF are now almost two per cent below baseline levels. This is the first year that Tasmania has achieved reductions on 1989-90 levels without reliance on its natural carbon storage advantages.
The reduction in Tasmania’s greenhouse gas emissions is considered to be especially significant, as during the same period of time the population of Tasmania has grown by 12 per cent, and the Tasmanian Gross State Product (GSP) has grown by 62 per cent. This demonstrates that Tasmania has decoupled the historic link between economic activity and emissions growth.
Emissions from the LULUCF sector have had a major influence on Tasmania’s total annual emissions, as shown in Figure 2. Unlike other sectors, emissions from the LULUCF sector show significant annual variation and have steeply declined since 2008-09. The reasons for this decline are discussed in the LULUCF sectoral analysis section of this report.
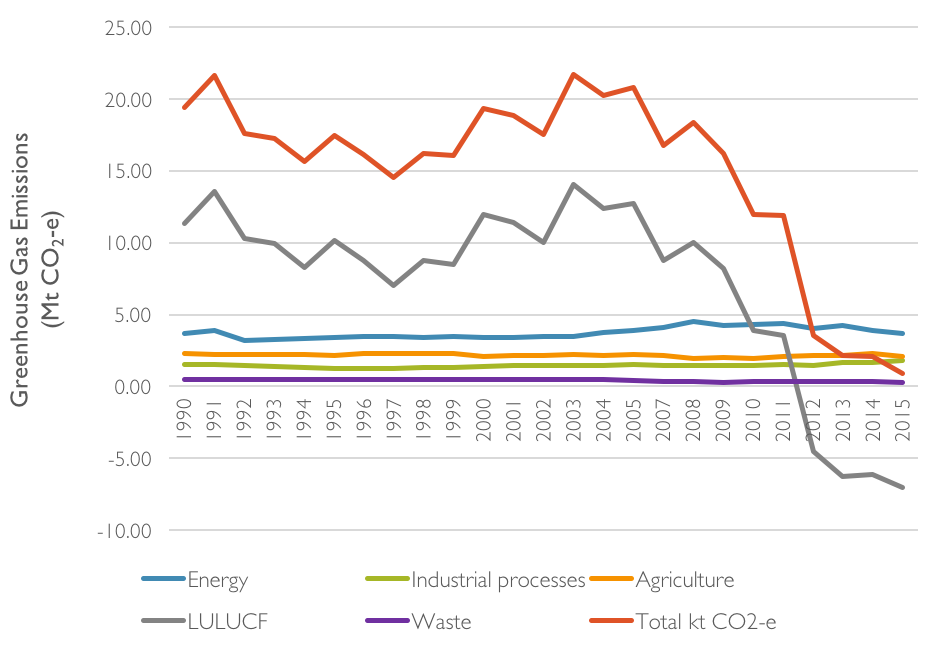
Figure 2: Tasmania’s greenhouse gas emissions from 1989-90 to 2014-15, by sector
Figure 3 shows contributions to total Tasmanian greenhouse gas emissions by sector in 2014‑15. Further discussion relating to the impact of subsectors on the greenhouse gas emissions for each sector is contained in the Emissions by sector section of this report.
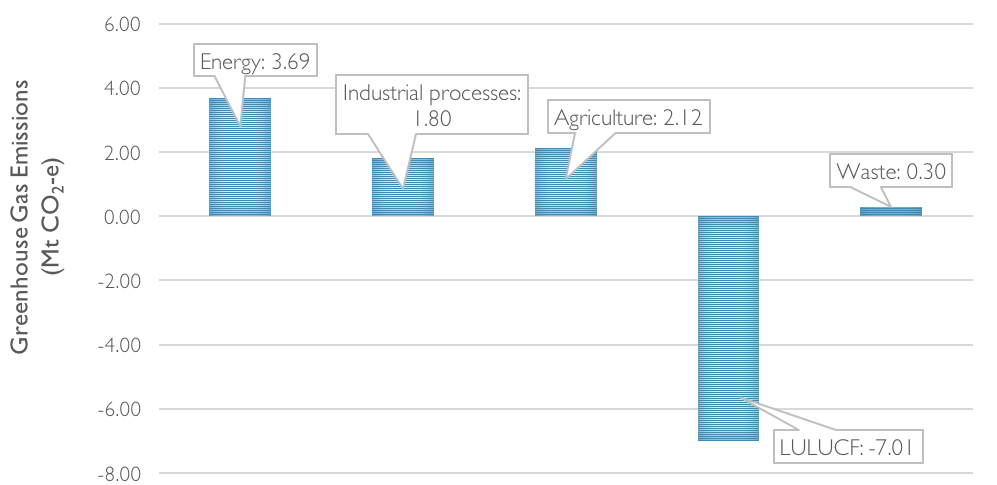
Figure 3: Tasmania's greenhouse gas emissions for 2014-15, by sector
Table 1 shows the change in both total and sectoral greenhouse gas emissions between the baseline year and 2014-15, while Table 2 shows the differences in Tasmania’s 2014-15 emissions by sector from the preceding year. Note that the percentage changes in this report are calculated on giga-tonnes of emissions, then converted to mega-tonnes and rounded to one decimal place.
| Sector | Emissions (Mt CO2-e) | Change (%) | |
|---|---|---|---|
| 1990 | 2015 | ||
| Energy | 3.72 | 3.69 | -0.7 |
| Industrial processes and product use | 1.56 | 1.80 | 15.7 |
| Agriculture | 2.32 | 2.12 | -8.5 |
| Land use, land use change and forestry | 11.35 | -7.01 | -162.0 |
| Waste | 0.47 | 0.30 | -37.0 |
| Sector | Emissions (Mt CO2-e) | Change (%) | |
|---|---|---|---|
| 2014 | 2015 | ||
| Energy | 3.90 | 3.69 | -5.4 |
| Industrial processes and product use | 1.68 | 1.80 | 7.0 |
| Agriculture | 2.29 | 2.12 | -7.5 |
| Land use, land use change and forestry | -6.11 | -7.01 | -14.8 |
| Waste | 0.34 | 0.30 | -13.5 |