
Emissions by sector
This section provides a sectoral analysis from a Tasmanian perspective, of the greenhouse gas emissions for the five reporting sectors.
Energy
The energy sector includes the following subsectors:
- Energy industries: includes emissions that result from the generation of electricity as well as combustion emissions from petroleum refining, oil and gas extraction and processing, coal mining and solid fuel manufacturing.
- Manufacturing industries and construction: includes emissions from on-site combustion of fossil fuels by the manufacturing, non-energy mining and construction sectors.
- Transport: includes emissions from the direct combustion of fuels in transportation by road, rail, domestic aviation and domestic shipping.
- Other sectors: includes emissions from energy used by the commercial, institutional and residential sectors, as well as fuel used by agricultural, fishery and forestry equipment.
- Other: includes all remaining fuel combustion emissions such as those from engine lubricants and greases.
- Fugitive emissions from fuels: includes emissions associated with the extraction and distribution of fossil fuels such as coal, oil and natural gas.
- CO2 transport and storage: includes emissions related to carbon capture and storage (CCS). Tasmania does not currently have any CCS projects operating.
The contribution of these subsectors to Tasmania’s energy sector greenhouse gas emissions is shown in Table 3 and Figure 4.
The emissions associated with electricity generated in Victoria and imported into Tasmania via Basslink are not included in Tasmania’s inventory; rather, they are included in the inventory figures for Victoria.
In 2014-15, the transport subsector continued to be the largest contributor to emissions from the energy sector, followed by manufacturing industries and construction. Emissions from the transport subsector increased by 8 per cent between 1989-90 and 2014-15. However, emissions have declined by almost 18 per cent from a peak in 2007-08 despite an increase in vehicle numbers over this period,[4] indicating an increase in the fuel efficiency of vehicles.
| Energy Subsector | Greenhouse Gas Emissions (Mt CO2-e) | Change (%) | |
|---|---|---|---|
| 1990 | 2015 | ||
| Energy industries | 0.57 | 0.11 | -81.2 |
| Manufacturing industries and construction | 1.00 | 1.29 | 28.6 |
| Transport | 1.58 | 1.71 | 8.3 |
| Total[5] | 3.72 | 3.69 | -0.7 |
While the greenhouse gas emissions attributed to Tasmania’s energy sector show a slight overall decrease of 0.7 per cent between the baseline year of 1989-90 and 2014-15, the various subsectors have shown significant fluctuations, particularly in recent times.
Stationary energy is a source category of emissions in the energy sector including the energy industries subsector and other direct combustion of fossil fuels in industries, such as manufacturing and construction. Stationary energy emissions account for approximately 52 per cent of emissions nationally. Yet they are a relatively low source of emissions in Tasmania, owing to the State’s renewable energy generation profile. At 1.9 Mt CO2-e, Tasmania has the lowest levels of stationary emissions of all the states and territories, except the Australian Capital Territory as most of its stationary energy is generated in New South Wales, it is a partial inventory with stationary energy emissions included in the New South Wales inventory.
Emissions from the energy industries subsector have decreased over the reporting period, as shown in Figure 4. When considering this decrease, it is important to take into account the Tasmanian Economic Regulator’s observations on Tasmanian electricity imports and generation:
…during 2014-15, the amount of electricity generated in Tasmania declined, with a significant increase in Basslink imports and a decline in exports. The change in Basslink flows was due partly to the removal of the carbon pricing mechanism, from 1 July 2014, but it also reflects reduced inflows and relatively low storage levels for hydro generation. During 2014-15, hydro generation declined by around one-third, compared with 2013-14. There was also less wind generation, due to weather conditions, while there was minimal thermal generation at the Tamar Valley Power Station (TVPS).[6]
Fluctuations in greenhouse gas emissions for the energy industries subsector between the introduction of natural gas into Tasmania, in 2003, and the 2014-15 emissions reporting year, are mainly due to the combustion of natural gas at the Bell Bay Power Station (2003-2009) and the TVPS (from 2009).

Figure 4: Tasmania’s energy sector greenhouse gas emissions from the 1989-90 baseline year to 2014-15, by subsector
The variation in emissions from the manufacturing industries and construction subsector can be attributed to a combination of economic activity, global commodity prices and methodology changes, such as emission factors.
Industrial processes and product use
The industrial processes and product use sector includes the following subsectors:
- Mineral industry:includes emissions that result from mineral processing industries, such as cement, lime, glass and limestone production and road paving with asphalt.
- Chemical industry:includes emissions from chemical production industries, such as soda ash and ammonia.
- Metal industry: includes emissions from the metal processing industries, such as aluminium, steel, iron and zinc production.
- Non-energy products from fuels and solvents use: includes emissions from production of lubricants, greases and solvents.
- Electronics industry: includes emissions from manufacture of integrated circuitry, semiconductors and photovoltaics.
- Product uses as substitutes for ozone depleting substances (ODS): includes emissions from synthetic halocarbons used in refrigeration, air-conditioning, foam blowing, fire protection and aerosols.
- Other product manufacture and use: includes emissions associated with the manufacture of other electrical equipment and compounds such as nitrous oxide, sulphur hexafluoride and perfluorocarbons.
- Other: includes emissions related to food and beverage industries, including the manufacture of beer, wine and alcoholic spirits.
Tasmania’s greenhouse gas emissions from the industrial processes and product use sector have increased by almost 16 per cent since 1989-90, despite a decline through the early 1990s as shown in Figure 5 and Table 4. This increase has resulted, in part, from the product uses as substitutes for ODS subsector and, more recently, emissions from food and beverage industries.
The phase out of ODS under the Montreal Protocol has resulted in consistent growth in emissions from the product uses as substitutes for ODS subsector, from just over 15 tonnes (t) CO2-e in 1993-94 (the first reported year for the subsector) to 0.25 Mt CO2-e in 2014-15. However, this growth is projected to slow by 2019‑20, due to the replacement of chlorofluorocarbons and hydrochlorofluorocarbons,[7] and the Australian Government phase down of hydrofluorocarbons following the Marrakech Climate Change Conference in November 2016.
| Industrial Processes & Product Use Subsector | Greenhouse Gas Emissions (Mt CO2-e) | Change (%) | |
|---|---|---|---|
| 1990 | 2015 | ||
| Mineral industry | 0.58 | 0.71 | 23.2 |
| Non-energy products from fuels and solvents use | 0.01 | 0.00 | -58.2 |
| Product uses as substitutes for ozone depleting substances | - | 0.25 | - |
| Other product manufacture and use | 0.01 | 0.00 | -50.0 |
| Other (food and beverage) | 0.97 | 0.84 | -13.7 |
| Total | 1.56 | 1.80 | 15.7 |
As Table 4 shows, in 2014-15 almost half the emissions in the industrial processes sector came from food and beverage industries. Annual fluctuations aside, this subsector has shown a general upwards trend in recent years, with a 31 per cent increase in emissions from 2008-09 levels.
AgriGrowth Tasmania notes developments in this industry through its annual Tasmanian Agri‑Food ScoreCard[8] reporting. Its observations between 2009-10 and 2014‑15 include:
- The volume of salmon produced (and therefore processed) increased by 52 per cent, from 30,949 t to 47,184 t;
- The volume of milk processed increased by 32 per cent, from 674 million litres to 891 million litres;
- The volume of beef processed increased by 27 per cent from 52,800 t to approximately 67,000 t; and
- There were several food and beverage processing factory upgrades that increased productivity over the period, including the opening of a large milk powder processing plant in Smithton in 2012.
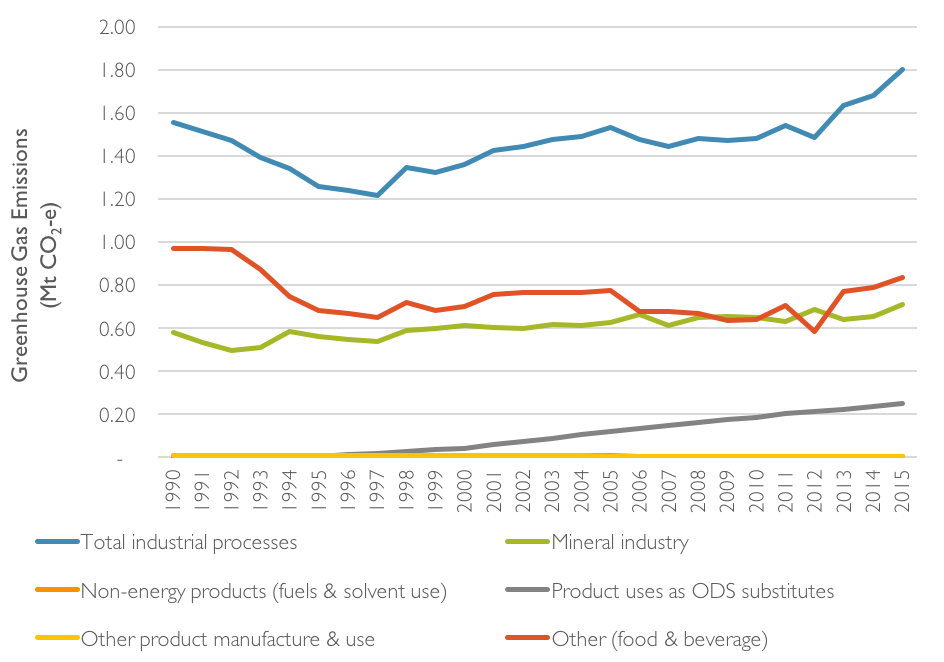
Figure 5: Tasmania’s industrial processes and product use sector greenhouse gas emissions from the 1989-90 baseline year to 2014-15, by subsector
Growth in the emissions from Tasmanian food and beverage processing appear consistent with national observations, and is largely being driven by export demand for Australian produce, which is currently expected to increase to 2019-20.[9]
Agriculture
The agriculture sector includes the following subsectors:
- enteric fermentation: includes emissions from the digestive processes of ruminant animals such as cows, sheep, pigs and goats.
- manure management: includes emissions from the decomposition of organic matter in manure under anaerobic conditions.
- rice cultivation: includes emissions during rice growing from the decomposition of plant residues and other organic carbon material in the soil.
- agricultural soils: includes emissions from microbial and chemical transformations that produce and consume nitrous oxide in the soil.
- liming: includes carbon dioxide emissions from the addition of limestone and dolomite to the soil to improve soil quality and plant growth.
- urea application: includes the loss of carbon dioxide from the addition of urea-based fertilisers to the soil.
- other carbon containing fertilisers:includes the loss of carbon dioxide from the addition of other carbon-based fertilisers to the soil.
- other: includes emissions from other sources of agricultural practices.
The agriculture sector comprises the emissions of methane and nitrous oxide only (that is, non-carbon dioxide gases) from livestock, crops, and agricultural and forest soils, and the emissions of carbon dioxide from the application of carbon containing soil additives.
The emissions from the field burning of agricultural land are not included in the inventory since it is assumed an equivalent amount of carbon dioxide was removed by the growing crop, in accordance with the IPCC Guidelines. Tasmania’s emissions from the various subsectors in the agriculture sector for the baseline year 1989-90 and 2014-15 are shown in Table 5.
| Agriculture Subsector | Greenhouse Gas Emissions (Mt CO2-e) | Change (%) | |
|---|---|---|---|
| 1990 | 2015 | ||
| Enteric fermentation | 1.88 | 1.57 | -16.8 |
| Manure management | 0.05 | 0.08 | 71.2 |
| Agricultural soils | 0.36 | 0.40 | 10.0 |
| Liming | 0.02 | 0.05 | 149.7 |
| Urea application | 0.01 | 0.03 | 210.4 |
| Total | 2.32 | 2.12 | -8.5 |
Emissions from Tasmania’s agricultural sector have declined by over 8 per cent between 1989‑90 and 2014-15. In 2015, almost 74 per cent of Tasmania’s total agricultural emissions were from enteric fermentation, followed by agricultural soils producing 19 per cent. The impact that the enteric fermentation subsector has on total emissions from the agriculture sector is demonstrated in Figure 6.
Figure 6: Tasmania’s agriculture sector greenhouse gas emissions from the 1989-90 baseline year to 2014-15, by subsector
Fluctuations in the reported emissions from Tasmania’s agricultural sector are due to a combination of factors including: the number of dairy and beef cattle, sheep and pigs; the number of lot fed and pasture fed animals; seasonal variability that impacts pasture growth and soil decomposition; and changes in management practices of manure, fertilisers and other soil additives.
Due to the impact of enteric fermentation on agricultural emissions, and as the subsector includes emissions from the digestive processes of ruminant animals such as cows, sheep, pigs and goats, Figure 7 indicates that the recent decline in sheep and cattle numbers has been the most likely driver of decreasing emissions from the sector.
The agricultural soils subsector produces the second highest emissions in the agricultural sector, in Tasmania. The subsector includes emissions of nitrous oxide from soils, which are added to the soil through processes including the application of nitrogen fertilisers, crop residues or animal wastes and sewage sludge to pastures, and mineralisation due to cultivation of organic soils or loss of soil carbon.
The increase in emissions from the agricultural soils subsector since 1989-90 was due to a combination of an increase in agricultural fertiliser use and retention of crop residues. As crop production, animal populations and fertiliser use reduced during drought, emissions declined between 2001 and 2009. The return to more favourable weather conditions has seen emissions increase more recently. However, the decline in emissions of 4.9 per cent observed in Tasmania in 2014-15 is likely to be due to a return to drought conditions impacting on farming practices.
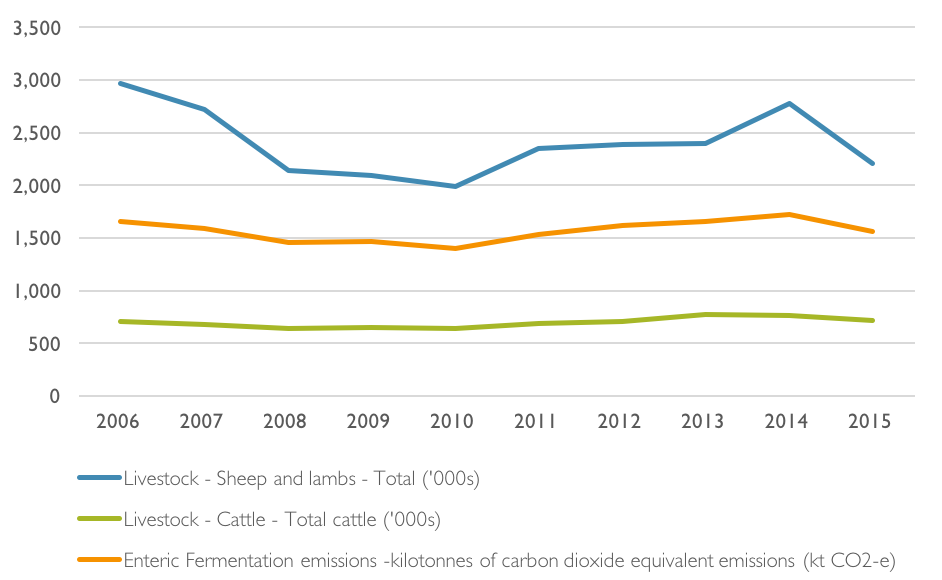
Figure 7: Comparison of agriculture (enteric fermentation) emissions and livestock numbers (‘000s)
Land use, land use change and forestry
This is the third year in which greenhouse gas emissions from the Kyoto Protocol reporting subsectors of forest management, cropland management and grazing land management have been included in Tasmania’s LULUCF sector. The LULUCF sector includes the following subsectors:
- afforestation and reforestation: includes emissions and removals (sinks) associated with forests and plantations established after 1990 on land that was previously cleared.
- deforestation: includes emissions and sinks from the human-induced conversion of forest and its replacement with pasture, crops or other uses on land that was forested on 1 January 1990.
- forest management: includes emissions from forests that are managed under a system of practices such as forest harvesting, silvicultural practices and the protection of natural resources in land available for harvest. This includes all multiple-use public forests as well as plantations established prior to 1990, which represents less than half of Tasmania’s native forests. It does not include the sinks from forests in Tasmania’s national parks and from much of the State’s privately owned native forest estate. It also includes prescribed burning and wildfires in native forests.
- cropland management: includes emissions from the cultivation of crops such as orchards and vineyards, and practices such as crop rotation, stubble management, tillage techniques and application of fertilisers, manures and irrigation.
- grazing land management: includes emissions from changes in specified management practices such as pasture management, seed selection, grazing intensity and fire management.
Tasmania’s emissions from the various subsectors in the LULUCF sector between the baseline year 1989-90 and 2014-15 are shown in Table 6 and Figure 8.
| LULUCF Subsector | Greenhouse Gas Emissions (Mt CO2-e) | Change (%) | |
|---|---|---|---|
| 1990 | 2015 | ||
| Afforestation and reforestation | 0.21 | -1.04 | -593.7 |
| Deforestation | 2.19 | 1.52 | -30.6 |
| Forest management | 6.07 | -7.69 | -226.7 |
| Cropland management | 0.08 | 0.02 | -75.8 |
| Grazing land management | 2.81 | 0.18 | -93.7 |
| Total | 11.35 | -7.01 | -161.8 |
The most significant contribution of greenhouse gas emissions from the LULUCF sector is from the forest management subsector, which has changed from a major source of emissions in the baseline year to currently be a carbon sink.
Greenhouse gas emissions and removals from the forest management subsector are driven mainly by short-term factors including timber harvesting, local and exported timber products and forest thinning, and longer-term factors associated with tree growth in Tasmania’s public native forests and re-growth in plantations established prior to 1990. The forest management subsector also includes the emissions and removals from prescribed burning and wildfires in native forests.
However, the removals associated with the longer-term effects of tree growth and re-growth, and to a lesser extent changes in soil carbon related to the harvesting, decomposition and
re-growth cycles, exhibit a lagged effect in the emissions inventory reporting. While there is a correlation between the greenhouse gas emissions and removals from the harvesting of Tasmania’s public and private native forests and plantations as shown in Figure 8, the long-term effects of tree growth and re-growth mean there can be a divergence in some years.
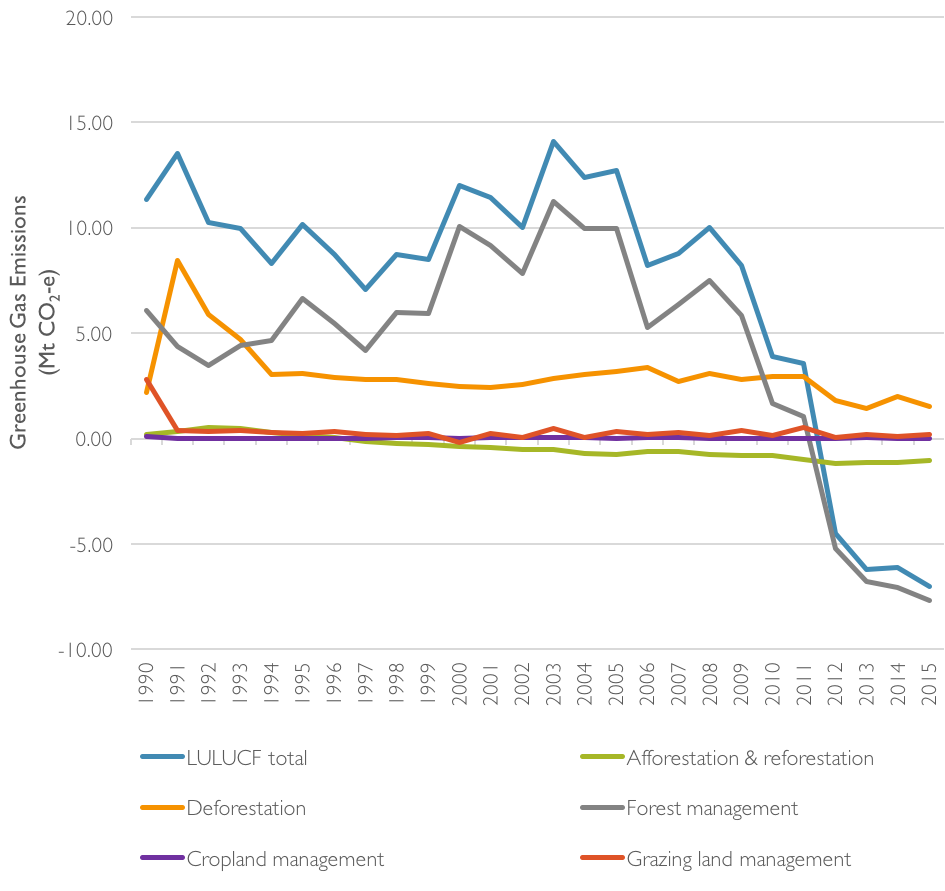
Figure 8: Tasmania’s LULUCF sector greenhouse gas emissions from the 1989-90 baseline year to 2014-15, by subsector
The Tasmanian forestry industry has undergone significant structural change over the last decade which has resulted in annual volumes of softwood and hardwood timber harvested from both native forests and plantations declining from 7.0 million m3 in 2007-08 to approximately 2.4 million m3 in 2012‑13.[10]
The reduction in harvested timber volumes was attributed to a combination of the implementation of the Tasmanian Forest Agreement in 2012,[11] the shrinkage of the Japanese pulpwood market as a result of the Global Financial Crisis, and global commodity prices.
In 2014-15, the volume of softwood and hardwood timber harvested from native forests and plantations increased to nearly 3.5 million m3,[12] with much of this increase coming from the volumes of hardwood timber harvested from Tasmanian plantations.
However, it is noticeable in Figure 8 that LULUCF emissions declined by nearly 14.8 per cent in the financial year to 2015. Although the total volume of logs harvested has recently risen, the volume of hardwood from Tasmania’s private native forests has remained at very low levels in recent years and the associated LULUCF emissions have not yet demonstrated an upwards trend.
The Forest Practices Authority Annual Report 2014‑15[13] records fewer hectares of native forests logged (which is counted under the forest management subsector, shown as declining in Figure 8) in the years from 2012 to 2015, than in the years up to and including 2011. While the overall area harvested is still smaller than pre-2011, both the 2013‑14 and 2014‑15 years are recorded as two of the largest areas of plantation timber harvested in a single year.[14] In addition, the Private Forests Tasmania Annual Report 2014-15[15] shows the volume of timber harvested from Tasmania’s private native forests has been at very low levels, below 100,000 tonnes annually, between 2012-13 and 2014-15.
Much of the greenhouse gas emissions from timber harvested in Tasmania’s plantations established after 1990 will be accounted for under the afforestation and reforestation subsector, which is shown in Figure 8 to have risen slightly over the period.
A number of factors make it difficult to forecast the potential impact on Tasmania’s emissions profile in relation to timber harvesting volumes. These include: the complexity of the methodologies and models used to estimate levels of carbon sequestration and emissions for Tasmania’s public and private native forests and plantations; changing local and global markets for Tasmanian grown timber products; and impacts associated with a changing climate such as increased bushfire risk, pathogens and reduced growth from heat stress.
Waste
The waste sector includes the following subsectors:
- solid waste disposal: includes the emissions from the anaerobic decomposition of organic matter in landfill.
- biological treatment of solid waste: includes the emissions from processes such as windrow composting and enclosed anaerobic digestion.
- incineration and open burning of waste: includes the emissions from the incineration of solvents and municipal and clinical waste.
- wastewater treatment and discharge: includes the emissions from the anaerobic decomposition of organic matter in wastewater and the chemical processes of nitrification and denitrification in wastewater treatment plants.
The waste sector is a minor contributor to Tasmania’s total greenhouse gas emissions. In 2014‑15, emissions from this sector totalled 0.30 Mt CO2-e, which is a reduction of 37 per cent since 1989-90 as shown in Table 7.
| Waste Subsector | Greenhouse Gas Emissions (Mt CO2-e) | Change (%) | |
|---|---|---|---|
| 1990 | 2015 | ||
| Solid waste disposal | 0.31 | 0.23 | -27.0 |
| Biological treatment of solid waste | 0.00 | 0.00 | - |
| Incineration and open burning of waste | - | - | - |
| Wastewater treatment and discharge | 0.15 | 0.06 | -58.1 |
| Total | 0.47 | 0.30 | -36.7 |
The reduction in emissions from the waste sector has occurred largely since 2003-04, which is shown in Figure 9. This reduction can be largely attributed to the installation of energy generators and/or landfill gas flaring equipment at Hobart, Glenorchy, Launceston and Dulverton landfills, as well as an increase in recycling and the diversion of organic materials from landfill.
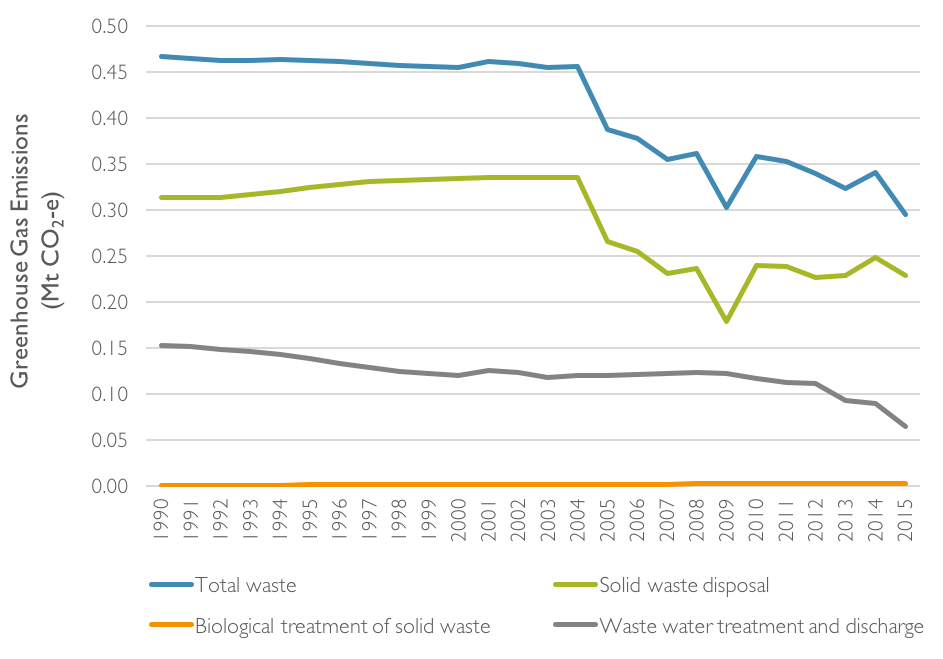
Figure 9: Tasmania’s waste sector greenhouse gas emissions from the 1989-90 baseline year to 2014-15, by subsector
Nationally, it was reported that emissions from municipal solid waste disposal decreased by 42.2 per cent over the period 1990 to 2015, mainly due to increases in methane recovery. In recent years, as rates of recycling have increased, paper disposal in particular has declined as a share of total waste disposed.
It was further noted that alternative waste treatment options are becoming more viable, driven by state and territory waste management policies. Changes in emissions for the wastewater treatment and discharge subsector are largely driven by changes in industry production, population loads on centralised treatment systems and the amount of methane recovered for combustion or flaring.