
Other performance measures
This section provides an overview of Tasmania’s emissions against other key performance measures, including greenhouse gas emissions per capita and emissions per dollar of Gross State Product (GSP).
Emissions per capita
Greenhouse gas emissions per capita provide a measure of the average emissions taking into account changes in population. Tasmania’s per capita greenhouse gas emissions, which have fallen from a peak of 46.3 t of CO2-e person in 1991 to 1.72 t CO2-e person in 2015, are shown in Figure 10.
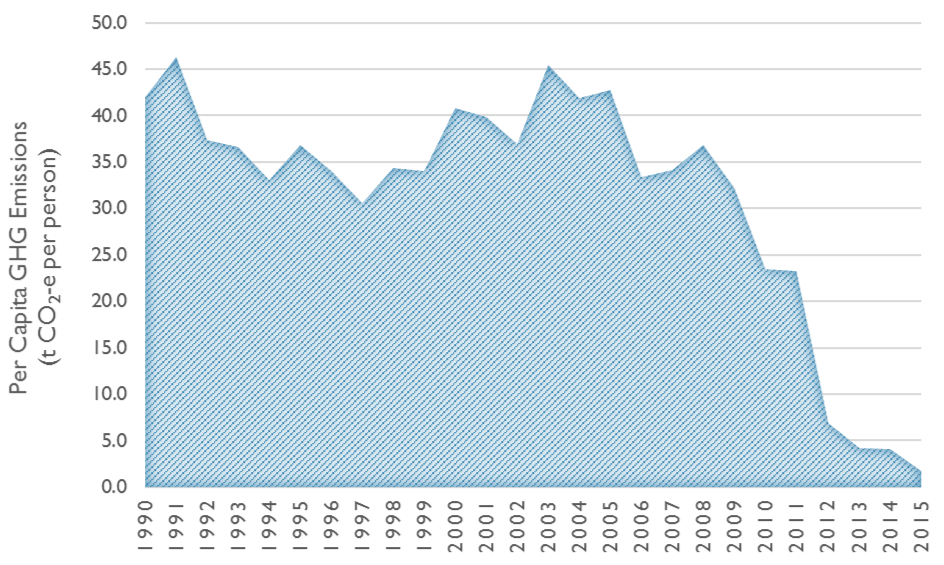
Figure 10: Tasmania’s greenhouse gas emissions per capita (t CO2-e per person) from 1989-90 to 2014-15
In 2014-15, Tasmania’s greenhouse gas emissions per capita was the lowest of all Australian states and territories, as shown in Figure 11. The jurisdiction with the second lowest emissions per capita is the Australian Capital Territory, however, this is only a partial inventory as most of its stationary energy is generated in New South Wales and the associated emissions are included with the New South Wales inventory.
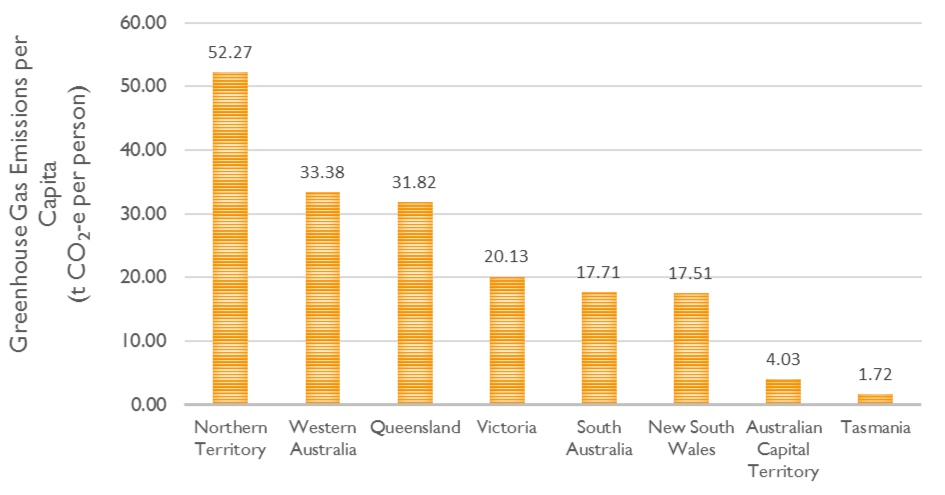
Figure 11: Comparison of state and territory emissions per capita (t CO2-e per person) in 2014‑15
Emissions per dollar of GSP
The greenhouse gas emissions per dollar of GSP provides an indicator of the emission intensity or productivity of the economy, and is calculated by dividing Tasmania’s net greenhouse gas emissions by the value of its GSP. Since 1989-90, Tasmania’s emissions per dollar of GSP has declined significantly, from 1.2 kg CO2-e per dollar of GSP, down to 0.03 kg CO2-e per dollar in 2014-15, as shown in Figure 12. This is despite a 62 per cent increase in GSP over the same period.
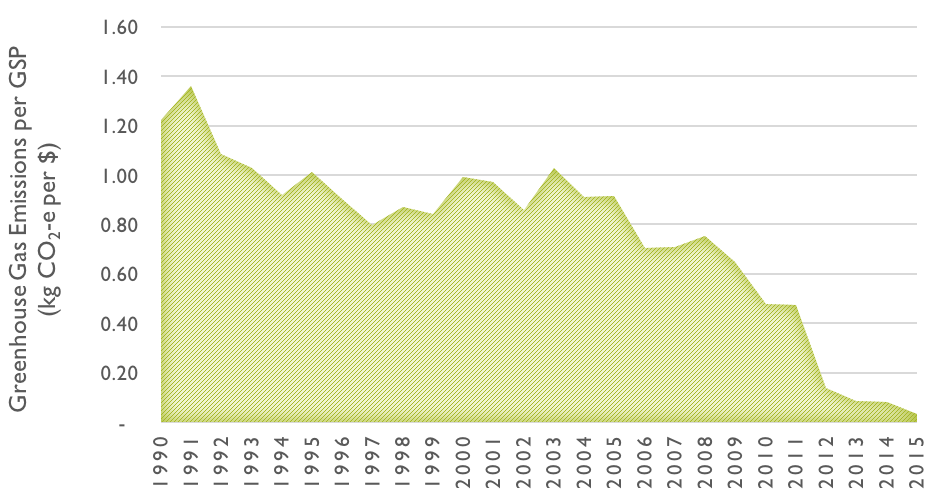
Figure 12: Greenhouse gas emissions per dollar of Gross State Product (kg CO2-e per $)